Who has the Ability to Pay?
Posted by Anthony Abercrombie on June 6, 2017
Estimating ability to pay for individual households is tricky because:
a ) Census and ground-level surveys are costly, slow, and become outdated quickly.
b) There are few records of past solar/microgrid/clean energy projects and investments in Myanmar.
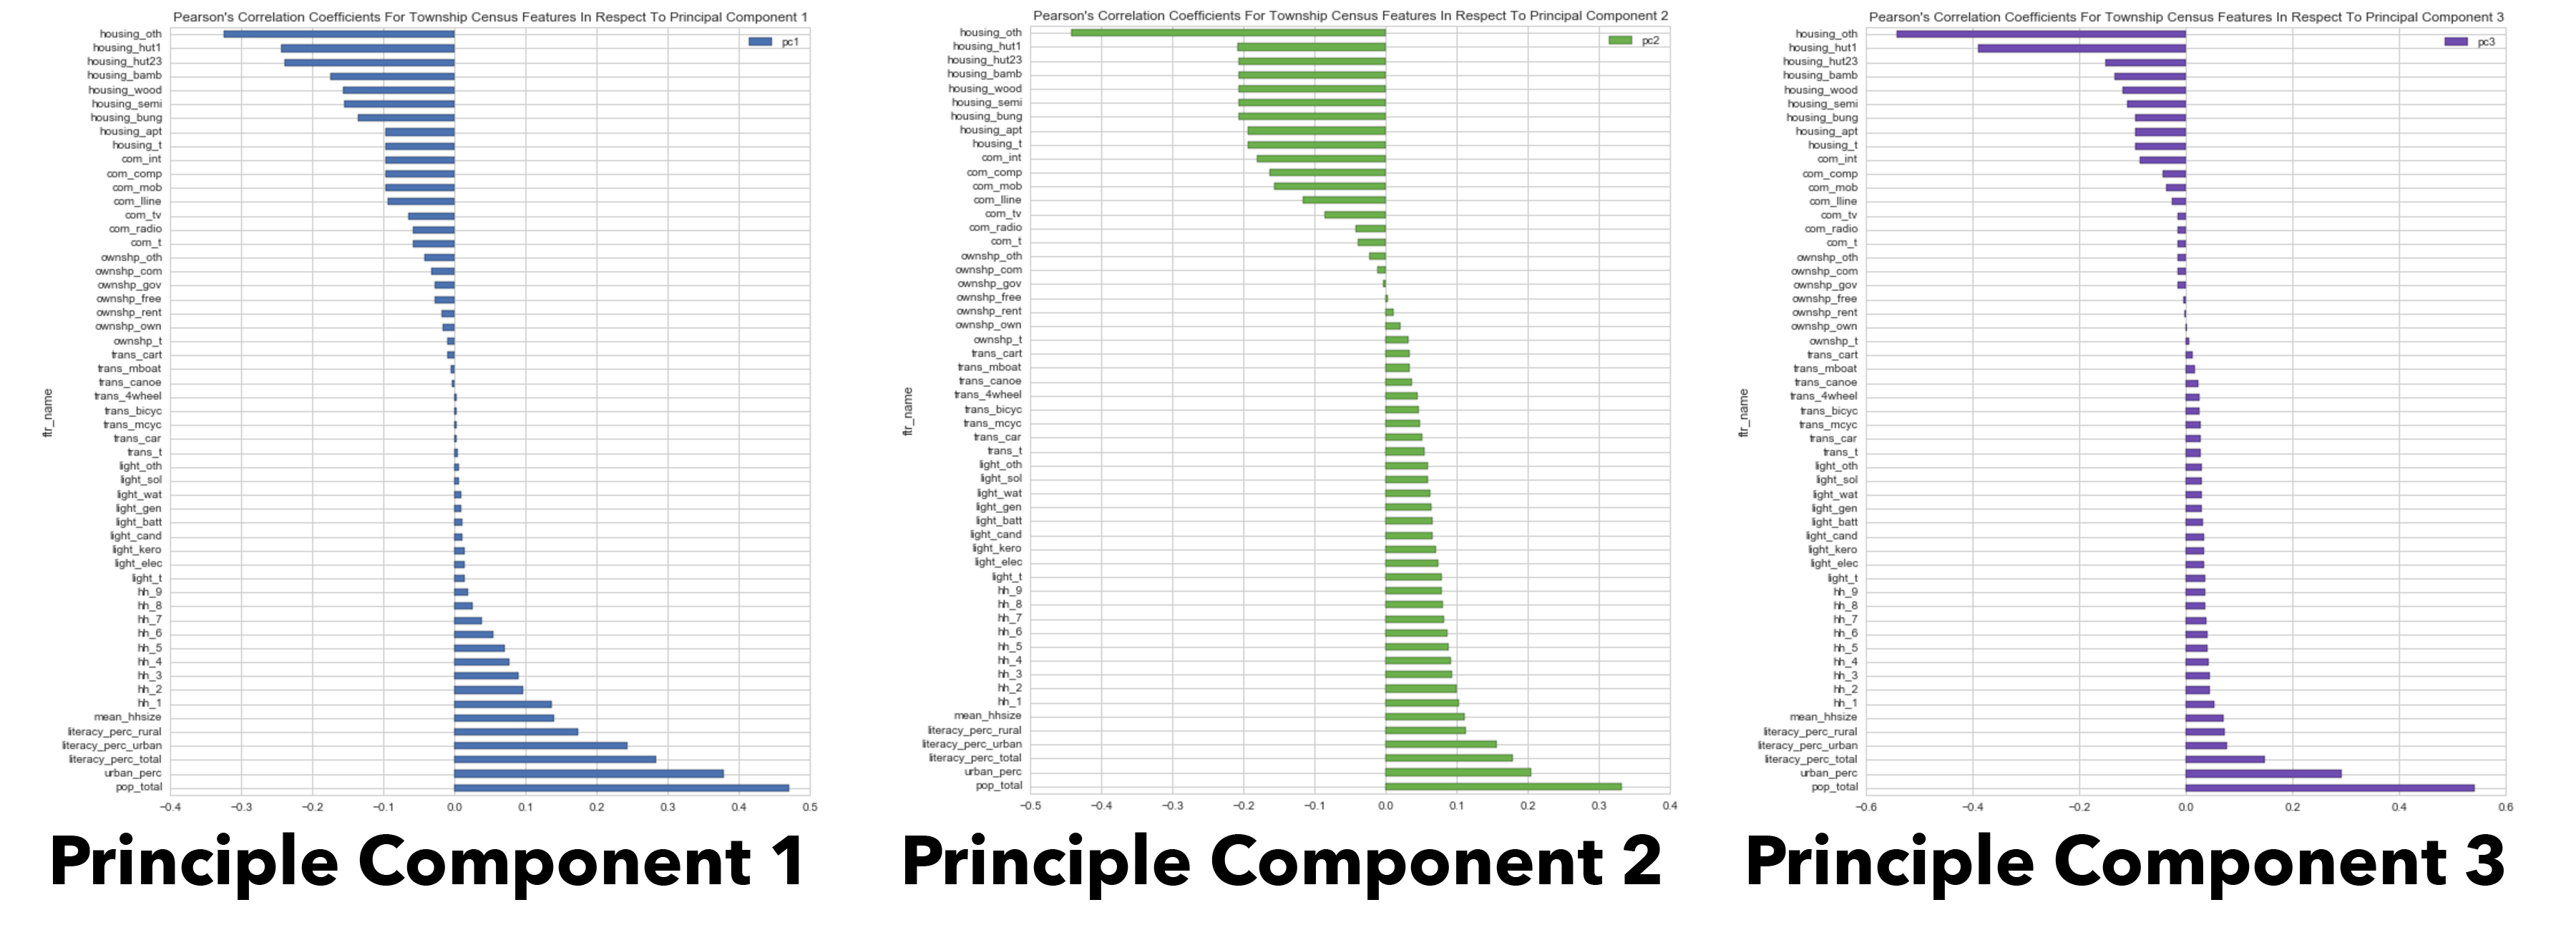
Township level data seemed the most promising and tractable given the available resources. We used township level census data and Principal Component Analysis (PCA) to create a standardized *development index for comparing townships relative to one another. PCA is a statistical tool used for identifying patterns in data and reducing the dimensions of datasets (number of columns) to a manageable set of features with minimal information loss. Using PCA, we were able to explain 90% of the variance across 73 census features with only 3 enriched features.
The first principal component was able to explain 53% of the variance of the dataset, and we present it as a proxy development index for evaluating a townships overall affluence and ability to pay. For more information on the algorithm, visit this site.
We derived and subsequently applied PCA to 73 census features from the raw township census data that quantify the following township characteristics:
- Building Material (e.g. hut, bamboo, wood, brick)
- Building Ownership Status (e.g. owner, renter, government)
- Communication Assets (e.g. mobile phones, radio, television, landlines)
- Transportation Assets (e.g. cars, boats, motorcycles, bicycles, carts)
- Light Sources (hydro, generators, battery, candles, kerosene, electricity)
- Household Size (1-9)
- Literacy Rate
- Population
- Urban Coverage
The degree to which each feature correlates with each principal component can be expressed with Pearson’s Correlation Coefficient. Below we visualize the correlation coefficients for each variable, revealing the underlying dichotomy and profiles of urban and rural townships.

The first principal component per township is displayed geographically below.
Townships displayed with darker values are generally more developed/urban. For instance, Mandalay and Yangon have the largest first principal component values. We propose that green and turquoise townships far from the preexisting power grid (shown in black lines) are prime candidates for solar microgrid development on the basis of ability to pay and need.
