Dimensionality Reduction with Principal Component Analysis
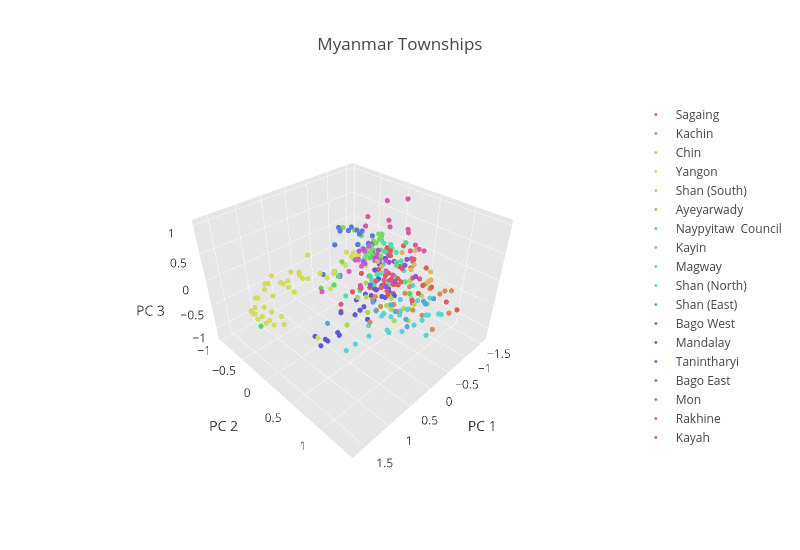
We used township level census data and Principal Component Analysis (PCA) to create a standardized *development index for comparing townships relative to one another. PCA is a statistical tool used for identifying patterns in data and reducing the dimensions of datasets (number of columns) to a manageable set of features with minimal information loss. Using PCA, we were able to explain 90% of the variance across 73 census features with only 3 enriched features, which is convenient for a 3D data viz. For more information on the algorithm, visit this site. Try rotating and hovering over this viz using your mouse/track pad.
We derived and subsequently applied PCA to 73 census features from the raw township census data that quantify the following township characteristics: Building Material (e.g. hut, bamboo, wood, brick), Building Ownership Status (e.g. owner, renter, government), Communication Assets (e.g. mobile phones, radio, television, landlines), Transportation Assets (e.g. cars, boats, motorcycles, bicycles, carts), Light Sources (hydro, generators, battery, candles, kerosene, electricity), Household Size (1-9), Literacy Rate, Population, and Urban Coverage. The degree to which each feature correlates with each principal component can be expressed with Pearson's Correlation Coefficient. Here’s another good map for exploring sub township level data. Check out the other maps on our Visualize page to discover more.
